Akridata, an AI platform for visual data, announced the first availability of its platform that provides data science teams the tools to easily explore, search, analyze, and compare visual data to improve data sets and improve model training.
Akridata Announces General Availability of New AI Platform for Visual Data
Three Ways Data Scientists are Fighting COVID-19
Data scientists in academia, non-profits, and the government have come together to track and respond to the economic & humanitarian impacts of the coronavirus. Put together by our friends over at SafeGraph, here are three ways data scientists are fighting COVID-19.
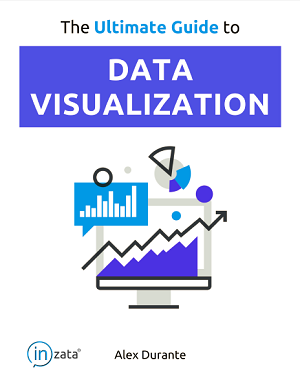
The Ultimate Guide to Data Visualization
“The Ultimate Guide to Data Visualization” eBook by Inzata, discusses how data visualization is all about communication. With clear, easy to read charts and visuals, the information can be effectively read and understood. This guide discusses the different types of visualizations, the appropriate time to use each one, and how to design visuals that will communicate the data clearly.
New Way of Looking at Data Can Help Improve College Enrollment Insights and Student Retention
In this contributed article, Taylor Riggs, Director of Data Visualization and Customer Success at GlyphEd, observes that every day, more colleges and universities are using data analytics to improve their admissions and student success metrics. But as the amount of student and organizational data increases, it can be hard to find the “needle in the haystack.” Enter the glyph, a unique way of holistically visualizing all the data known about a student – allowing enrollment teams to see more and know more, faster.
Interview: Vinod Bakthavachalam, Data Scientist at Coursera
I recently caught up with Vinod Bakthavachalam, Data Scientist at Coursera, to discuss how to build in-demand skills in data science such as machine learning, statistics, and data management across your organization to drive competitive advantage. Coursera for Business provides companies with the world’s best learning experience and best content to transform their talent.
When Big Data Meets Data Visualization: How to Make Your Data Actionable
In this contributed article, technology writer and blogger Kayla Matthews discusses how society is growing increasingly familiar with data visualization and its beneficial impact on data analysis and actionability. The power of analysis is largely contingent on the presentation of data. The best forms of data visualization convey useful insights, while poor efforts can distract from actionable insight.


